


A cooling curve is one of the most useful outputs of thermal analysis for cast iron foundries.
When a sample of molten iron cools and solidifies inside a thermal analysis cup, its temperature changes continuously with time. The resulting temperature-versus-time curve, known as the cooling curve, contains information about the solidification behavior of the melt.
For foundry engineers, the important question is not simply how to obtain a cooling curve, but:
What does the curve actually tell you about the molten iron?
By analyzing characteristic points such as the liquidus temperature, eutectic temperature, undercooling, recalescence, and end of solidification, a foundry can evaluate melt condition and adjust its process before defects appear in production.

What Is a Cooling Curve in Cast Iron?
A cooling curve is a graph showing the temperature of molten iron as a function of time while the sample cools and solidifies.
The basic relationship is:
Temperature = f(time)
A typical curve can be divided into several stages:
- Molten state
- Primary solidification
- Eutectic solidification
- Recalescence
- Completion of solidification
Each stage corresponds to changes occurring inside the molten iron.
Thermal analysis is therefore more than simply measuring temperature. It uses the thermal history of a small sample to evaluate the solidification behavior of the melt. ASM describes cooling-curve analysis as a method for studying solidification temperature, structure, phase formation, and casting-process conditions.

The Main Stages of a Cast Iron Cooling Curve
Stage 1: The Molten State
Immediately after the sample is poured into the thermal analysis cup, the metal is completely liquid.
The temperature decreases relatively smoothly as heat is transferred from the molten metal to the cup and surrounding environment.
At this stage:
No major solidification reaction has started yet.
The cooling rate is primarily controlled by heat transfer.
Stage 2: Liquidus Temperature
The first major characteristic point is the liquidus temperature (TL).
The liquidus temperature indicates approximately where primary solidification begins.
For hypoeutectic cast iron, primary austenite begins to form as the melt crosses the liquidus temperature.
In practical thermal analysis, the liquidus arrest is identified from a change in the cooling behavior rather than simply from the chemical composition.
This temperature is important because it is related to the melt’s composition and carbon-equivalent condition.
Why does liquidus matter?
Changes in liquidus temperature can indicate changes in:
- Carbon equivalent
- Carbon content
- Silicon content
- Alloy additions
- Melt chemistry
This is one reason thermal analysis can provide rapid information about melt condition without waiting for a conventional laboratory chemical analysis.
Primary Solidification
After the liquidus temperature is reached, primary solidification begins.
For a typical hypoeutectic cast iron, austenite forms first.
As the solid phase develops, latent heat is released. This changes the rate at which the sample temperature falls.
The cooling curve therefore begins to deviate from the simple cooling behavior of a completely liquid sample.
The temperature difference between the liquidus and later eutectic region provides useful information about the solidification range.
A commercial thermal-analysis system may use this information together with calibration relationships to estimate composition-related parameters such as carbon equivalent and carbon content.
Eutectic Solidification
The next major event is the eutectic reaction.
For cast iron, the eutectic reaction is particularly important because it determines much of the final solidification behavior and strongly influences graphite or carbide formation.
Depending on the conditions, cast iron can solidify through:
- Stable graphite eutectic solidification
- Metastable carbide eutectic solidification
- Or a mixture of behaviors
The cooling curve provides evidence of how the eutectic reaction develops.
This is one of the reasons cooling curves are so valuable for gray and ductile iron production.
Eutectic Undercooling
One of the most important features to understand is eutectic undercooling.
The actual eutectic reaction may not begin exactly at the equilibrium eutectic temperature.
Instead, the liquid may cool below the expected temperature before sufficient nucleation occurs.
The difference is referred to as undercooling.
A simplified relationship is:
ΔT = Tₑ − Tₘᵢₙ
where:
- Tₑ = reference eutectic temperature
- Tₘᵢₙ = minimum temperature reached during eutectic undercooling
- ΔT = degree of undercooling
Commercial thermal-analysis systems commonly identify the undercooling point and calculate the corresponding undercooling value.
Why Is Undercooling Important?
Undercooling provides information about the nucleation and solidification behavior of the iron.
A relatively large eutectic undercooling can be associated with increased chill tendency or a greater tendency toward carbide formation under certain conditions.
Research on gray cast iron has found relationships between thermal-analysis parameters such as eutectic undercooling and chill tendency.
For foundry engineers, this means that an unusual increase in undercooling should not simply be treated as a number on a screen.
It can be a warning that the melt’s nucleation or inoculation condition has changed.
Recalescence: Why Does the Curve Rise Again?
One of the most recognizable features of a cast iron cooling curve is recalescence.
After the temperature reaches a minimum during undercooling, the curve may rise temporarily.
This happens because the solidification reaction releases latent heat faster than the sample can lose heat to its surroundings.
The simplified sequence is:
Cooling → Undercooling → Nucleation → Latent heat release → Temperature rises → Cooling resumes
The temperature rise between the undercooling minimum and the subsequent maximum is called recalescence.
A simplified expression is:
ΔTᵣ = Tₘₐₓ − Tₘᵢₙ
where:
- Tₘᵢₙ = minimum temperature during undercooling
- Tₘₐₓ = maximum temperature reached during recalescence
- ΔTᵣ = recalescence
Recalescence is particularly useful when evaluating ductile iron solidification behavior and graphite nucleation. Studies have found correlations between thermal-analysis parameters, including recalescence and eutectic undercooling, and ductile-iron nodule characteristics.
What Does a Large or Small Recalescence Mean?
Recalescence should not be interpreted in isolation.
Its significance depends on:
- Iron composition
- Carbon equivalent
- Magnesium treatment
- Inoculation practice
- Nodule count
- Cooling conditions
- Casting section size
For ductile iron, thermal-analysis systems can use multiple cooling-curve parameters to evaluate nodularization and solidification behavior.
Therefore, a foundry should establish its own acceptable range rather than assuming that one universal recalescence value represents good or bad iron.
End of Solidification
Eventually, the remaining liquid disappears and solidification is completed.
The corresponding characteristic temperature is often referred to as the solidus or end-of-solidification temperature (TS).
The time between the beginning and end of solidification provides a measure of the solidification time.
This information can be useful when comparing:
- Different heats
- Different inoculation practices
- Different compositions
- Different cooling conditions
The end of solidification is also important because the final stage of solidification can influence casting soundness and shrinkage behavior.
The Most Important Points on a Cooling Curve
For practical foundry work, the following parameters are particularly useful:
| Cooling-Curve Parameter | What It Indicates |
|---|---|
| Liquidus temperature (TL) | Start of primary solidification and composition-related behavior |
| Eutectic temperature | Characteristics of eutectic solidification |
| Undercooling temperature | Degree of cooling below the reference eutectic temperature |
| Recalescence temperature | Heat released during eutectic solidification |
| Recalescence | Difference between minimum and maximum eutectic temperatures |
| End-of-solidification temperature | Completion of solidification |
| Solidification time | Duration of the solidification process |
| Cooling rate | Rate of temperature change |
Not every thermal-analysis instrument reports exactly the same parameters or uses identical terminology. Commercial systems can calculate a larger set of characteristic values from the curve and its derivatives.
Cooling Curve and Carbon Equivalent
Cooling curves are closely related to carbon equivalent (CE).
In cast iron, CE provides a convenient way to describe the combined influence of carbon and major graphitizing elements on solidification behavior.
The liquidus and eutectic characteristics of the cooling curve can therefore be used by calibrated thermal-analysis systems to estimate CE.
This is an important distinction:
The cooling curve itself is the measured thermal data.
CE is a calculated metallurgical parameter derived from that data using an appropriate calibration/model.
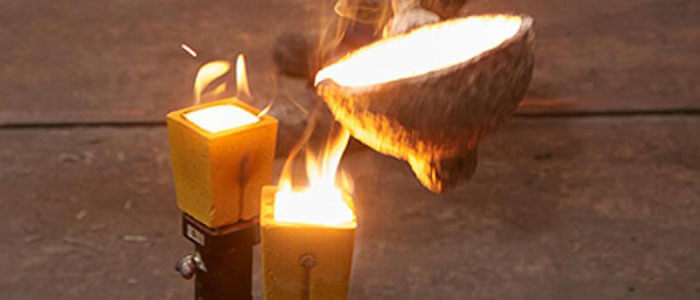
SF-Foundry’s thermal-analysis cups are designed for use with thermal-analysis systems that can determine carbon equivalent, carbon, and silicon from the solidification behavior of molten iron.
For a detailed explanation of CE itself, see:
What Is Carbon Equivalent (CE) in Cast Iron and Why Does It Matter?
And for the measurement methods:
How to Measure Carbon Equivalent in Cast Iron
These articles should be internally linked here rather than repeating the complete CE calculation discussion.
Cooling Curves in Gray Cast Iron
For gray iron, the cooling curve can provide useful information about the tendency toward graphite formation and the stability of the solidification process.
Important factors include:
- Liquidus temperature
- Eutectic temperature
- Eutectic undercooling
- Recalescence
- Solidification time
Inoculation can significantly affect nucleation behavior and therefore the shape and characteristic points of the cooling curve.
If undercooling becomes excessive, the foundry may need to investigate:
- Inoculant addition
- Inoculation timing
- Base-iron condition
- Holding time
- Melt chemistry
- Sulfur level
- Treatment practice
Thermal analysis is therefore useful not only for checking composition but also for monitoring metallurgical condition.
Cooling Curves in Ductile Iron
Cooling-curve analysis is especially useful for ductile iron because graphite morphology is strongly influenced by melt treatment and nucleation conditions.
After magnesium treatment and inoculation, the cooling curve can provide information about the resulting solidification behavior.
Parameters such as:
- Eutectic undercooling
- Recalescence
- Eutectic temperatures
- Solidification time
- Derivative-curve characteristics
can be used together to evaluate the melt.
Research has demonstrated relationships between cooling-curve parameters and ductile-iron nodule count and nodularity.
However, thermal analysis should be treated as a process-control tool, not as a direct replacement for metallographic examination.
If the casting is critical, final microstructure should still be verified using appropriate laboratory methods.
What Can an Abnormal Cooling Curve Tell You?
One of the biggest advantages of thermal analysis is that it can reveal changes before they become obvious in finished castings.
For example:
| Observation | Possible Cause to Investigate |
|---|---|
| Liquidus temperature shifts | Chemistry or CE change |
| Increased undercooling | Poor nucleation, insufficient inoculation, or melt-condition change |
| Abnormal recalescence | Change in nucleation or graphite formation behavior |
| Changed solidification time | Composition or thermal-condition change |
| Strong difference between heats | Sampling, cup, temperature, or melt-treatment inconsistency |
| Unexpected carbide tendency | Inoculation, chemistry, cooling rate, or nucleation issue |
These are diagnostic directions, not one-to-one diagnoses.
A cooling curve tells you that the solidification behavior has changed. The foundry must then investigate the process variables responsible for that change.
Why Two Similar Cooling Curves Can Still Produce Different Castings
This is an important limitation.
A thermal-analysis sample is a small test sample solidifying under controlled conditions. A real casting may have:
- Different wall thicknesses
- Different cooling rates
- Different mold materials
- Different thermal gradients
- Different feeding conditions
- Different local solidification environments
Therefore, the cooling curve should not be interpreted as an exact prediction of every location inside the casting.
Instead, it is most powerful as a rapid and repeatable indicator of melt and solidification condition.
For this reason, foundries often establish historical reference curves for stable production and compare new heats against those references.
What Causes Cooling-Curve Variation?
If two samples from the same foundry produce significantly different curves, investigate both the metal and the measurement system.
Metal-related factors
- Carbon content
- Silicon content
- Carbon equivalent
- Alloy additions
- Inoculation
- Magnesium treatment
- Holding time
- Pouring temperature
- Nucleation condition
Measurement-related factors
- Sampling location
- Sampling temperature
- Time between sampling and pouring
- Thermal-analysis cup condition
- Cup geometry
- Thermocouple position
- Instrument calibration
SF-Foundry’s existing guidance emphasizes that consistent cup geometry, wall thickness, thermocouple placement, sampling practice, and instrument compatibility are important for repeatable thermal-analysis results.
This is why a strange cooling curve should not automatically be blamed on the melt.
The Thermal Analysis Cup Matters
The cooling curve is produced by the interaction between the molten metal sample and the measurement system.
The thermal analysis cup controls part of the heat-transfer environment, while the thermocouple records temperature as the sample cools.
Consequently, differences in:
- Cup geometry
- Wall thickness
- Refractory material
- Internal treatment
- Thermocouple position
can influence the measured curve.
SF-Foundry’s thermal-analysis cup information specifically highlights cup geometry, wall thickness, material composition, and thermocouple placement as important design factors for consistent results.

This leads to a practical rule:
If you want to compare cooling curves over time, keep the sampling and measurement conditions as consistent as possible.
A Practical Workflow for Using Cooling Curves
A foundry can integrate cooling-curve analysis into its melt-control process as follows:
Step 1: Take a representative sample
Use a suitable ceramic fiber sampling spoon and avoid slag or contaminated material.
Step 2: Transfer the sample quickly
Pour the molten iron into the appropriate thermal-analysis cup under consistent conditions.
Step 3: Record the cooling curve
The thermocouple continuously records temperature as the sample solidifies.
Step 4: Identify characteristic points
Review:
- Liquidus
- Eutectic temperature
- Undercooling
- Recalescence
- End of solidification
Step 5: Compare with the target range
Compare the result with the foundry’s established reference values for the specific iron grade.
Step 6: Adjust the melt if necessary
Depending on the result, the foundry may investigate chemistry, inoculation, nodularization, temperature, or other process parameters.
Step 7: Confirm the final result
For critical production, combine thermal analysis with chemical analysis, metallography, mechanical testing, or other quality-control methods as required.
This creates a closed-loop process:
Sampling → Thermal Analysis → Interpretation → Melt Adjustment → Casting → Quality Verification
SF-Foundry already supplies several products used within this workflow, including ceramic fiber sampling spoons, thermal-analysis cups, and fast thermocouples.
Cooling Curve vs. Chemical Analysis
Thermal analysis and chemical analysis answer related but different questions.
| Method | Main Information |
|---|---|
| Chemical analysis | Elemental composition |
| Thermal analysis | Solidification behavior |
| Cooling curve | Temperature history during solidification |
| Metallography | Actual microstructure |
| Mechanical testing | Final material properties |
A spectrometer or chemical analyzer may tell you what elements are present.
A cooling curve can tell you how the melt is behaving during solidification.
This is why thermal analysis can be valuable for rapid process control even when a foundry also performs laboratory chemical analysis.
Cooling Curves Should Be Used for Trend Monitoring
A single cooling curve can provide useful information, but a series of curves is much more powerful.
For example, a foundry can record:
Heat 101 → Heat 102 → Heat 103 → Heat 104 → Heat 105
and track:
- Liquidus trend
- Eutectic undercooling
- Recalescence
- Solidification time
- CE trend
If several heats are stable and one suddenly deviates, the deviation becomes a useful signal for investigation.
This is one of the strongest practical applications of thermal analysis:
not just measuring one heat, but continuously monitoring the stability of the melting and treatment process.
Frequently Asked Questions
What is a cooling curve in cast iron?
A cooling curve is a graph of temperature versus time recorded while a molten cast iron sample cools and solidifies. It contains information about liquidus, eutectic solidification, undercooling, recalescence, and the end of solidification.
What does the liquidus temperature tell you?
The liquidus temperature indicates the approximate start of primary solidification and is related to the composition and carbon-equivalent condition of the iron.
What is eutectic undercooling?
Eutectic undercooling is the degree to which the melt cools below a reference eutectic temperature before eutectic solidification becomes established.
What is recalescence in cast iron?
Recalescence is the temporary temperature rise that can occur after undercooling as latent heat is released during solidification.
Can a cooling curve measure carbon equivalent?
A calibrated thermal-analysis system can estimate carbon equivalent from characteristic temperatures and other cooling-curve information. The exact calculation depends on the instrument, calibration, cup type, and iron system.
Can cooling curves predict ductile-iron nodularity?
Cooling-curve parameters can provide useful information related to nodularization and graphite morphology, but they should not be regarded as a complete replacement for direct microstructural examination.
Why are my cooling curves inconsistent?
Possible causes include differences in sampling, pouring temperature, transfer time, cup condition, thermocouple position, instrument calibration, melt chemistry, inoculation, or nodularization treatment.
Final Takeaway
A cast iron cooling curve is much more than a temperature graph.
It provides a window into the solidification behavior of molten iron.
The most important features to understand are:
- Liquidus temperature — when primary solidification begins
- Eutectic temperature — characteristics of eutectic solidification
- Undercooling — how far the melt cools before nucleation becomes established
- Recalescence — heat released during the solidification reaction
- End of solidification — when the remaining liquid has solidified
- Solidification time — how long the solidification process takes
When these parameters are monitored consistently, thermal analysis can help foundries identify changes in melt chemistry, nucleation, inoculation, nodularization, and solidification behavior before those changes become casting-quality problems.
The most effective approach is not to interpret one curve in isolation, but to build a reference database of stable cooling curves for each iron grade and use thermal analysis for continuous process control.
Related Resources
For a complete understanding of thermal analysis in cast iron, continue with:
- What Is Carbon Equivalent (CE) in Cast Iron and Why Does It Matter?
- How to Measure Carbon Equivalent in Cast Iron
- Thermal Analysis Cups (Sampling Cups): What Foundries Need to Know
- Step-by-Step Guide: How to Use a Ceramic Fiber Sampling Spoon for Cast Iron Analysis
SF-Foundry supplies thermal-analysis cups, carbon cups, ceramic fiber sampling spoons, fast thermocouples, and other foundry consumables for molten-iron measurement and quality control.
If your foundry is selecting thermal-analysis cups or sampling tools, the cup design, thermocouple configuration, sampling procedure, and analyzer compatibility should all be considered together to achieve repeatable cooling-curve results.