


Choosing the right molten metal analysis method is one of the most critical decisions a foundry can make. Get it wrong, and you risk costly rework, scrap, and lost productivity. Get it right, and you unlock faster turnaround, tighter quality control, and significant cost savings.
For decades, foundries have relied on two primary tools for melt quality control: thermal analysis cups and optical emission spectrometers (OES) . Both serve the same ultimate purpose—ensuring your molten iron meets specification before pouring—but they operate on fundamentally different principles and deliver very different value propositions.
This guide breaks down how each technology works, their strengths and limitations, and—most importantly—which one is right for your foundry operation.
What Is a Thermal Analysis Cup?
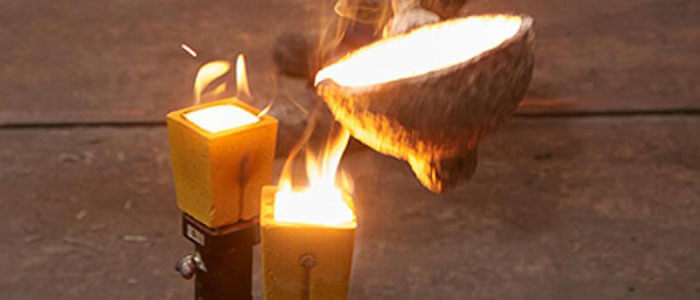
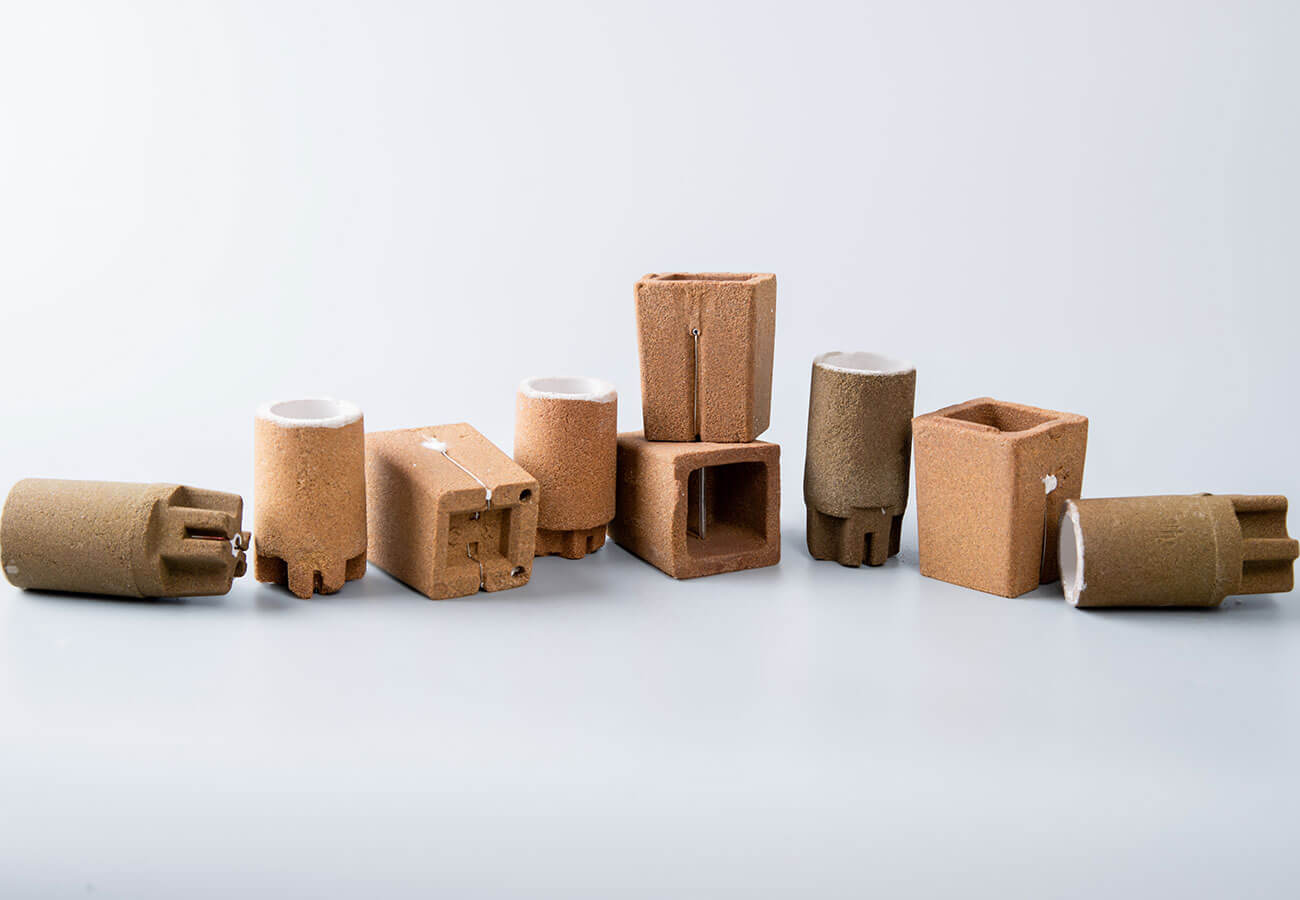
A thermal analysis cup (also called a sampling cup, carbon cup, or CE cup) is a small, disposable container made from refractory material—typically ceramic or silica sand with a binder. It holds a sample of molten metal while a thermocouple (usually Type K) inserted into the cup measures the cooling curve as the metal solidifies.
How It Works
The principle is elegantly simple:
-
Pour a small amount of molten metal from the ladle or furnace into the cup.
-
Measure the temperature continuously as the metal cools and solidifies.
-
Analyze the cooling curve to identify key phase changes—the liquidus arrest (where primary phase begins to form) and eutectic arrest (where remaining liquid solidifies).
-
Calculate carbon content, silicon content, and carbon equivalent (CE) based on these characteristic temperatures.
What It Measures
| Parameter | What It Tells You |
|---|---|
| Carbon Equivalent (CE) | Combined effect of carbon and silicon on solidification |
| Carbon content (C%) | Critical for gray and ductile iron properties |
| Silicon content (Si%) | Affects graphite formation and matrix structure |
| Liquidus temperature | Where solidification begins |
| Eutectic temperature | Where graphite forms |
| Cooling curve shape | Indicates nodularization quality in ductile iron |
Beyond chemistry, thermal analysis can also measure the physical aspects of solidification—nucleation potential, graphite shape, carbide propensity, and solidification pattern. This is a critical advantage: thermal analysis doesn’t just tell you what is in your melt; it tells you how that melt will behave when it solidifies.
What Is a Spectrometer?
An optical emission spectrometer (OES) is a sophisticated analytical instrument that determines the elemental composition of a metal sample by measuring the characteristic wavelengths of light emitted when the sample is excited by an electrical spark or arc.
How It Works
-
Sample preparation—a sample must be taken from the melt and cooled (typically in a chilled mold) to produce a solid disk.
-
Excitation—the sample is placed in the spectrometer, where a high-energy spark vaporizes a small amount of material.
-
Detection—the emitted light is passed through a diffraction grating and detected by sensors (CMOS or PMT detectors), with each element producing a unique spectral signature.
-
Quantification—software calculates the concentration of each element based on the intensity of its spectral lines.
What It Measures
Spectrometers deliver broad elemental coverage. A modern OES can simultaneously measure dozens of elements—carbon, silicon, manganese, chromium, copper, molybdenum, nickel, and many more—at concentrations ranging from major alloying elements down to trace impurities.
Key distinction: Spectrometers measure chemical composition only. They cannot directly assess microstructural characteristics or solidification behavior.
Head-to-Head Comparison
| Factor | Thermal Analysis Cup | Spectrometer (OES) |
|---|---|---|
| Measurement time | 1.5–3 minutes | 30–40 seconds per sample |
| What it measures | CE, C%, Si%, plus solidification behavior | Full elemental composition (dozens of elements) |
| Sample preparation | None—pour directly from ladle | Required—must cast and prepare solid sample |
| Cost of entry | Low (cups are consumables; analyzer is affordable) | High (instrument costs tens to hundreds of thousands) |
| Operating cost | Per-cup consumable cost | Argon gas, maintenance, calibration standards |
| Maintenance | Minimal | Regular calibration, cleaning, PMT/CMOS upkeep |
| Skill required | Low—operator simply pours and reads | Moderate—requires trained technician |
| Portability | Highly portable—use anywhere on the floor | Typically stationary (though portable models exist) |
| Element coverage | Limited to C, Si, CE | Comprehensive—all alloying and trace elements |
The Critical Difference: Chemistry vs. Behavior
This is the single most important distinction between the two technologies:
A spectrometer tells you what is in your iron. Thermal analysis tells you how that iron will behave when it solidifies.
Spectrometers measure chemical composition with high precision. They will tell you, for example, that your melt contains 3.45% carbon and 2.10% silicon. But carbon in solution behaves differently than carbon in graphite. The same chemical composition can produce very different microstructures depending on nucleation conditions, cooling rate, and inoculation practice.
Thermal analysis captures the actual solidification behavior of your specific melt. It sees the nucleation events, the graphite formation, the carbide tendency—all the physical phenomena that determine final casting quality. As one industry expert put it, thermal analysis provides a “qualitative evaluation of the melt” that allows prediction of microstructure and mechanical characteristics.
The Spectrometer’s Hidden Cost: Time
A spectrometer’s 30–40 second analysis time sounds fast. But that’s only the instrument run time. The full workflow tells a different story.
Spectrometer workflow:
-
Take sample from ladle
-
Pour into chilled mold
-
Wait for sample to solidify and cool
-
Grind and polish the sample surface
-
Place in spectrometer and run analysis
In many foundries, this process adds 10–15 minutes to the melt cycle while waiting for lab results. For high-powered, medium-frequency furnaces, this delay can result in 20–25% lost melt capacity.
Thermal analysis workflow:
-
Pour directly from ladle into the cup
-
Read results in 1.5–2 minutes
-
Make adjustments while the furnace is still under power
The difference is profound. With thermal analysis, you can determine carbon and silicon before the furnace reaches tapping temperature, make your corrections, and have the heat ready to go the moment it reaches temperature. No waiting. No lost capacity.
One foundry analysis found that recovering that lost melt capacity alone could boost productivity an additional 10–15% per day.
When to Choose Thermal Analysis
Thermal analysis is the right choice when:
Your primary concern is carbon and silicon control
If your operation uses consistent scrap sources and carbide stabilizers (manganese, chromium, copper) are reasonably stable from heat to heat, thermal analysis gives you everything you need.
You need results now
For furnace operators who need to make real-time adjustments, waiting 10–15 minutes for lab results is simply not acceptable.
You’re a smaller foundry without a spectrometer lab
Thermal analysis provides an affordable path to quality control that would otherwise be out of reach.
You care about microstructure, not just chemistry
If you’re producing ductile iron and need to monitor nodularity, or gray iron and need to control inoculation, thermal analysis gives you direct insight into solidification behavior that a spectrometer cannot provide.
You want to maximize melt capacity
Every minute saved in the melt cycle translates directly to more tons per day. For foundries operating at capacity, that’s pure profit.
When to Choose a Spectrometer
A spectrometer is the right choice when:
You need full elemental analysis
If your specifications require tight control over multiple alloying elements (chromium, molybdenum, nickel, copper, etc.) or you need to verify trace elements and impurities, a spectrometer is essential.
You’re producing high-end castings
Aerospace, automotive safety-critical, and other demanding applications require comprehensive elemental verification that thermal analysis cannot provide.
You need certification and traceability
For customers requiring certified material test reports (MTRs), a spectrometer provides the documented, auditable results needed.
You process multiple alloy types
If your foundry runs different alloys (gray iron, ductile iron, steel, aluminum, copper-based), a spectrometer offers the flexibility to handle them all.
The Reality: Most Foundries Need Both
Here’s the truth that many suppliers won’t tell you: thermal analysis and spectrometry are complementary, not competitive.
The most efficient foundries use both:
-
Thermal analysis at the furnace for real-time process control—adjusting carbon and silicon on the fly, monitoring inoculation, and ensuring melt quality before tapping.
-
Spectrometer in the lab for final verification, certification, and monitoring of alloying elements and trace impurities that thermal analysis cannot measure.
As one industry observer noted, “Redundancy has its payback”. The thermal analysis gives you immediate, actionable data. The spectrometer gives you the comprehensive verification and documentation your customers demand. Together, they provide unmatched quality control.
For foundries with the highest quality standards, this two-tier approach is standard practice: thermal analysis for real-time furnace control, spectrometer analysis for certification and monitoring of slowly changing elements like carbide stabilizers.
Making the Decision: A Framework
| Your Foundry Profile | Recommendation |
|---|---|
| Small foundry, consistent scrap, limited budget | Start with thermal analysis |
| Medium foundry, multiple alloys, quality certification required | Invest in both—thermal for furnace, spectrometer for lab |
| Large foundry, high-volume production | Both are essential—thermal for melt capacity, spectrometer for comprehensive QC |
| Specialty/ aerospace foundry | Spectrometer is non-negotiable; thermal adds valuable process insight |
| Ductile iron specialist | Thermal analysis is critical for nodularity control; spectrometer for full chemistry |
Summary
| Thermal Analysis Cup | Spectrometer | |
|---|---|---|
| Best for | Real-time process control, C/Si/CE, microstructure prediction | Comprehensive elemental analysis, certification, multi-element control |
| Speed | 1.5–3 minutes from pour to result | 30–40 seconds run time + 10+ minutes sample prep |
| Cost | Low entry cost, consumable ongoing | High capital investment, maintenance costs |
| Sample | Pour directly from ladle | Must cast and prepare solid sample |
| Insight | Solidification behavior | Chemical composition |
The bottom line: If you need to know your carbon and silicon right now to make adjustments and keep the melt moving, thermal analysis is your tool. If you need comprehensive elemental verification for certification or multi-alloy processing, you need a spectrometer. And if you’re serious about quality and productivity—like most successful foundries—you need both.
Ready to learn more about thermal analysis cups for your foundry? Contact us or explore our thermal analysis cup product page for specifications and pricing.